6 7
7
 Year
Year
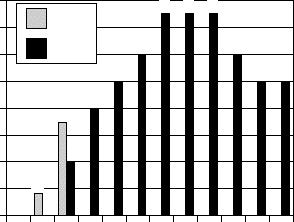
Figure 7. Expected goal for production in tons/a from central
leader trained peach orchards over the 12-year life of the orchard
vs. actual production obtained in years 2 and 3.

0 0
0
4.4
 3
3
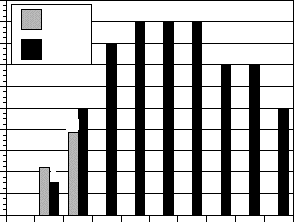
trained peach orchards over the 10-year life of the orchard vs.
actual production obtained in years 2 and 3.


![]() 7
7![]() Year
Year

![]() 1
1![]() 2
2![]() 3
3![]() 4
4![]() 5
5![]() 6
6![]() 7
7![]() 8
8![]() 9
9![]() 10
10![]() Year
Year![]() 0
0![]() 3
3